Small Files and Too Many Parts: Why Batching Your Inserts Matters
Tiny writes are cheap to send and expensive to keep. We wrote the same 2 million rows as 20,000 files and as 2: 2.9× the bytes, 54× the read time. Here's why batching matters.
Share

Tiny writes are cheap to send and expensive to keep. A pipeline that writes every event as it arrives feels simple. Then the file count climbs, queries slow, merges eat your disks, and one day inserts fail with a “too many parts” error.
Earlier editions sized, compressed and skipped data. This one is about how it lands on disk. We wrote the same 2.0 million synthetic rows as 20,000 tiny files and as 2 big ones, and measured the difference.
Five hidden costs of tiny writes
The unit has many names: file, part, segment. Each carries a fixed cost, so more units means more cost.
- Per-file overhead. Every file must be created, opened and have its footer read. That work doesn’t shrink when the file does.
- Worse compression. Compressors learn from the data in front of them. Tiny blocks give them little to learn from, and each repeats its own headers.
- Merge work. Engines that keep data immutable fix tiny parts later by merging them: reading and rewriting the same bytes.
- Write amplification. Each merge level rewrites data, so bytes written end up several times the bytes ingested.
- Query planning. A query must open and plan over every file. Thousands of files mean thousands of footers before reading starts.
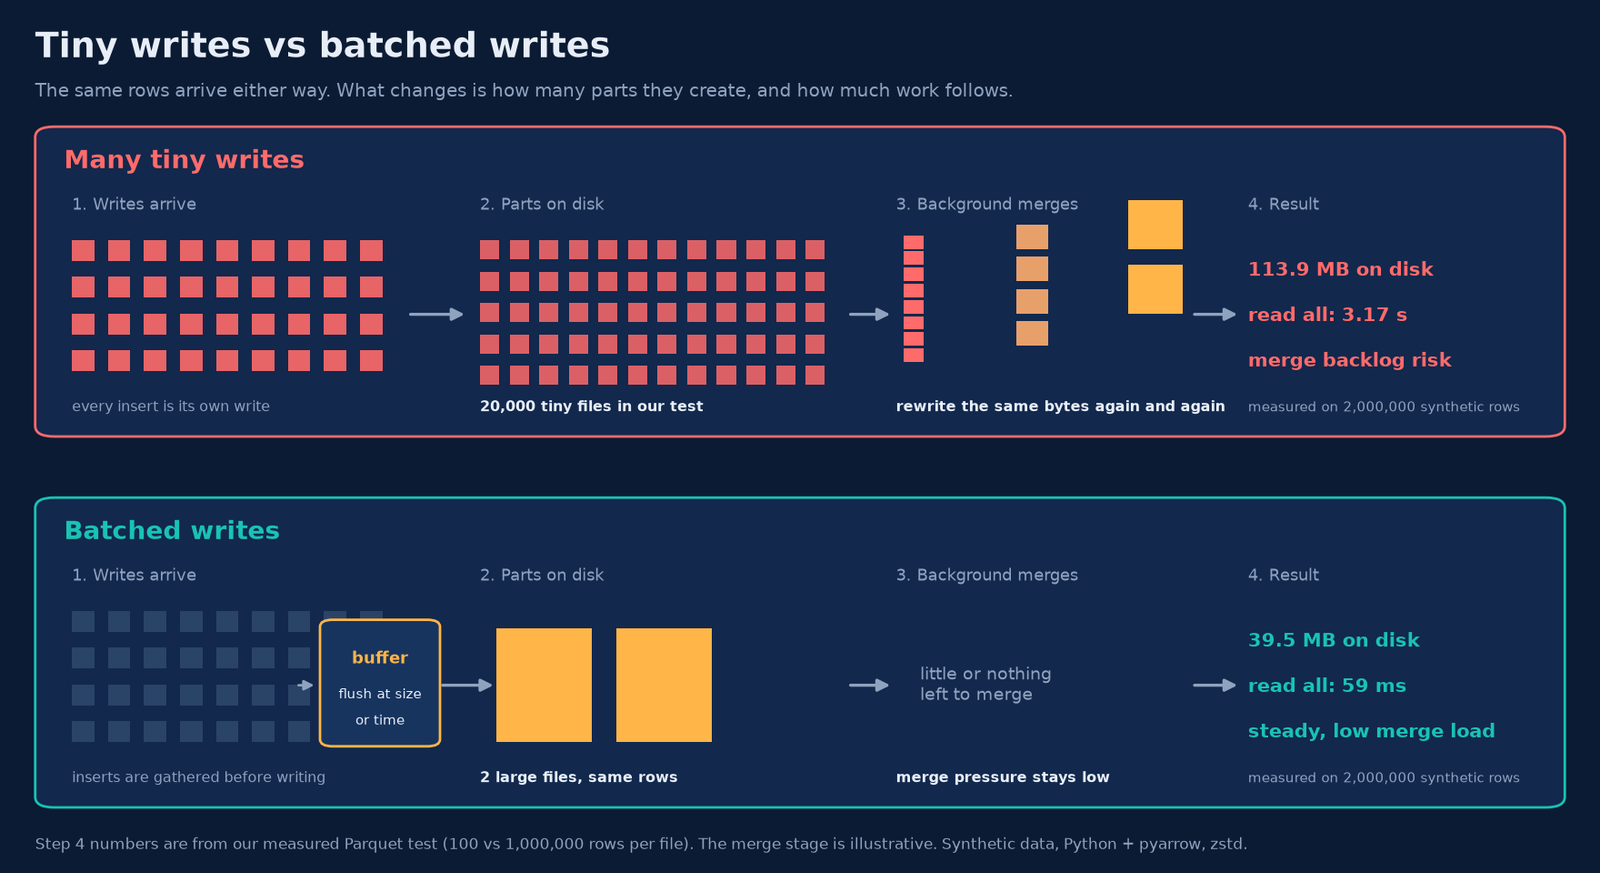
Our experiment: same rows, five file sizes
We generated 2,000,000 synthetic API events (8 columns: timestamp, service, endpoint, status, latency, response bytes, request ID and user ID) in time order, with a fixed seed. Using Python and pyarrow, we wrote them as Parquet with zstd compression in five layouts, from 100 rows per file to 1,000,000. We timed writing, scanning and filtering. It’s a storage model, not a specific database: read the ratios, not the absolute times.

- Bytes on disk: 20,000 files of 100 rows took 113.9 MB. Two files of 1,000,000 rows took 39.5 MB for identical data: 2.9 times smaller. Against 160 MB raw in memory, that’s 1.4 to 1 compression versus 4.1 to 1.
- Metadata: the 20,000 file footers alone added up to 35.6 MB, about 31% of everything on disk. For the two big files it was 3.8 KB.
- Reading everything (all columns, 8 threads): 3.17 s versus 59 ms, 54 times slower. With one thread it was 20.7 s versus 0.22 s.
- Just opening the files to read their metadata took 755 ms for the tiny layout and under 1 ms for the big one,.
- A selective query (one service, one column) took 2.09 s versus 22 ms, 94 times slower.
- Writing took 8.0 s versus 0.5 s: 16 times longer.
The gains flatten as files grow. At 100,000 rows per file (20 files) the scan took 46 ms, slightly faster than two 1,000,000-row files at 59 ms, because 8 threads had more files to share. Aim for files big enough to amortise the overhead, and numerous enough to read in parallel.
The Parquet docs recommend row groups of 512 MB to 1 GB for large sequential reads. Our biggest files were about 20 MB, small by that standard.
The merge tax, simulated
If your engine fixes tiny parts by merging them, the bill arrives later. In ClickHouse’s MergeTree family, each insert creates a part and background merges combine small parts into larger ones, as the ClickHouse parts documentation describes.
We measured real merges of 10 Parquet files into one on our test box: 9.1 ms to merge ten 100-row files, 343 ms to merge ten 100,000-row files. A straight-line fit gave about 14.6 ms of fixed cost per merge plus a cost per row. We fed that into a simulation of one merge thread merging 10 equal parts into 1, over 10 minutes of ingest. It’s a model, not a database benchmark.
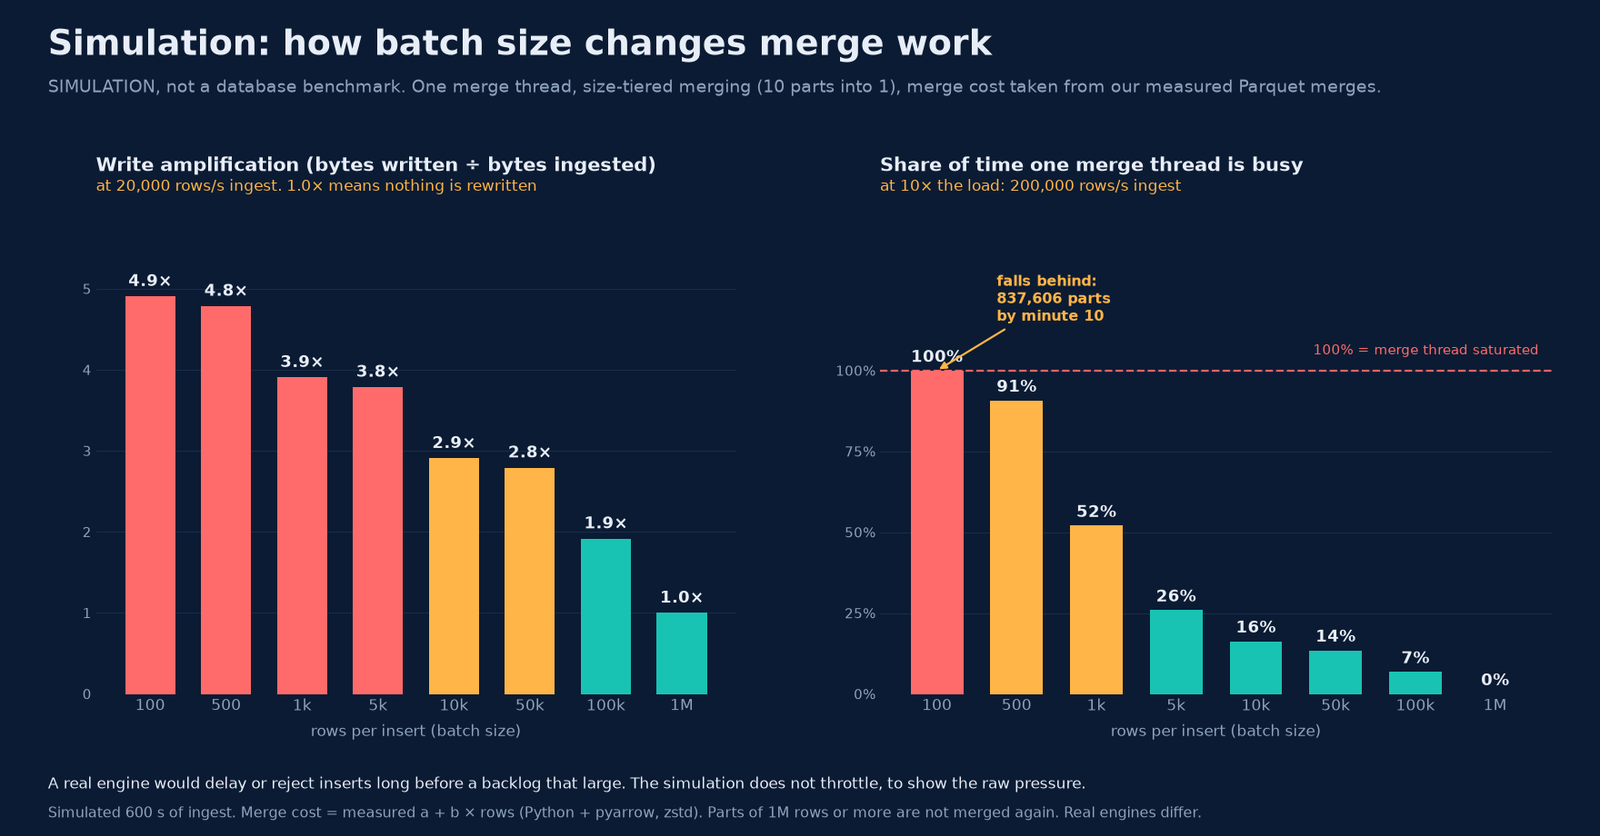
- At 20,000 rows per second, 100-row inserts created 200 parts per second (720,000 per hour). The simulated merger ran 13,328 merges, wrote 4.9 times the ingested rows, and was busy 35% of the time.
- With 10,000-row inserts: 2 parts per second, 130 merges, 2.9 times amplification, merger busy 1.6% of the time. With 1,000,000-row inserts, nothing needed merging.
- At 10 times the load, 100-row inserts saturated the merge thread. Parts piled up faster than they merged, passing 1,000 within a second and ending at 837,606. Real engines slow or reject inserts first.
How batching fixes it
- Size and time thresholds. Flush a batch when it reaches a row or byte limit, or when a timer expires, whichever comes first. Size keeps parts efficient. Time bounds staleness.
- Buffering. A queue, log or in-process buffer gathers many small producers into one writer. ClickHouse recommends inserting at least 1,000 rows at a time, ideally 10,000 to 100,000, and roughly one insert per second per table, according to its insert strategy guide.
- Async inserts. When clients can’t batch, some servers batch for them. ClickHouse’s asynchronous inserts buffer rows and flush on size (100 MiB by default), time (200 ms by default) or query count (450 by default), whichever hits first.
- Compaction. Rewrite small files into big ones on a schedule. In our test, compacting 20,000 files into 2 took 17.4 s and shrank the data from 113.9 MB to 39.5 MB. It works, but you pay for the mess.
The limits are real. ClickHouse MergeTree settings delay inserts above 1,000 active parts in a partition by default and reject them above 3,000 with “Too many parts”. Its troubleshooting guide warns that raising the limits only postpones the problem.
The trade-off: latency and safety
Batching buys efficiency with freshness. Rows in a buffer aren’t queryable yet, and can be lost if the buffer is lost before it flushes. Pick thresholds your users can tolerate.
Try it: insert batching estimator
Enter your write rate and batch size to see how many parts you create.
Insert batching estimator
How many parts does your write pattern create, and how hard must merges work?
Parts (inserts) per second
–
Parts per hour
–
Files per day (one file per part)
–
Average part size
–
Time between flushes
–
Time to 1,000 parts if nothing merged
–
× the 1-part-per-second guideline
–
Batch size for 1 part per second
–
A rough estimator, plain arithmetic. Parts per second = rows per second ÷ rows per batch. Per hour = × 3,600. Files per day = × 86,400, assuming one file per part. Part size = rows per batch × bytes per row. Time between flushes = rows per batch ÷ rows per second. Time to 1,000 parts = 1,000 ÷ parts per second. Pressure: up to 1 part per second is Low, up to 10 is Elevated, above 10 is High, based on ClickHouse’s guidance of about one insert per second and reports that rates above ten per second often trigger “too many parts” errors. Real systems differ. It assumes one table and partition. Decimal units: 1 MB = 1,000,000 bytes.
A practical checklist
- Count your parts. Know how many files or parts each table has right now.
- Batch before the write. Aim for about one write per second per table, with thousands of rows each.
- Partition coarsely, and compact. A batch spanning many partitions creates a part for each. Compact what still arrives small, and watch merge backlog.
Get Byte2MB in your inbox
One clear, illustrated data explainer, regularly. No fluff, just the bytes that matter. Subscribe to the Byte2MB newsletter and follow along.
Sources: ClickHouse, Selecting an insert strategy · ClickHouse, Table parts · ClickHouse, parts_to_* MergeTree settings · ClickHouse, Resolving the "Too many parts" exception · Apache Parquet, Configurations. File counts, bytes and timings come from Byte2MB's own test on synthetic events (2,000,000 rows, Python, pyarrow 26.0.0, Parquet + zstd, fixed seed, 8 CPUs, warm cache, best of 3). Merge-pressure figures are a simulation. The script is available on request.