Hot, Warm, Cold: How Data Retention Multiplies Your Observability Storage
Retention quietly multiplies your log and metric storage. Learn how hot, warm and cold tiers, TTLs and metric rollups keep observability data useful without keeping every byte forever.
Share

Most observability data is read once, if ever. You look at the last hour of logs during an incident, the last day of metrics on a dashboard, and maybe last month’s trend when someone asks for a report. Yet many systems keep every byte at full resolution, on the same fast disks, for as long as anyone can remember.
In the first Byte2MB edition we saw how a modest 1 KB event at 1,000 events per second becomes 86.4 GB a day. This edition is about the other half of that equation: how long you keep it, where you keep it, and in how much detail. That’s retention and tiering, and it’s often the biggest lever you have on storage size.
Retention is a multiplier
The amount of data you hold at any moment is simple to write down:
stored data = daily volume × retention days × copies
Ingest rate gets all the attention, but retention multiplies it quietly. Take that same 86.4 GB/day stream and keep a single copy:
- 7 days: 86.4 × 7 = 604.8 GB
- 30 days: 86.4 × 30 = 2,592 GB (about 2.6 TB)
- 90 days: 86.4 × 90 = 7,776 GB (about 7.8 TB)
- 365 days: 86.4 × 365 = 31,536 GB (about 31.5 TB)
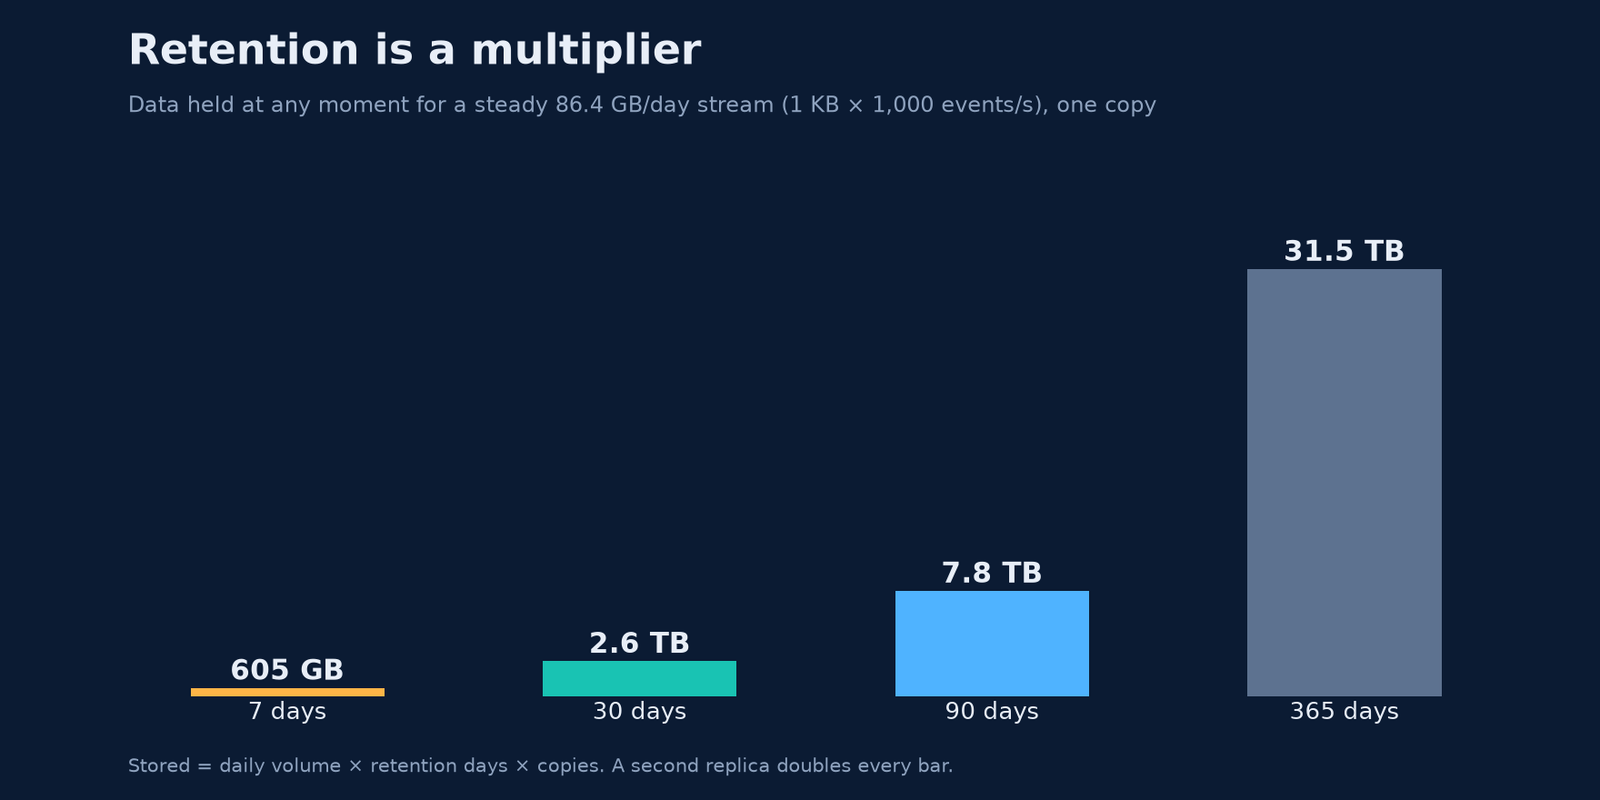
Add a replica for durability and every number doubles. Nothing about the workload changed. Only the policy did.
Want to try this with your own numbers? Plug your event size, rate and retention into the estimator below:
Quick answer
Stored bytes = events per second × bytes per event × 86,400 × retention days ÷ compression ratio. 2,000 events/s at 1,200 bytes, kept 30 days, compressed 4:1, is 1,555.2 GB. At $0.023 per decimal GB-month that is $35.77. The same bytes are 1,448.392868 GiB, or $33.31 if the vendor bills 2^30-byte gigabytes.
The formula
Start from the event, not from a feeling about “a lot of logs.” Bytes per day = events/s × event bytes × 86,400. Multiply by the retention window. That product is the raw footprint: the data you would store if you kept every byte. Divide by the compression ratio. A ratio of 4 means you keep a quarter. Then multiply the stored gigabytes by the price per GB-month.
The footprint levels off. You are not billed for every byte ever written. You are billed for the window you chose to keep. Doubling retention roughly doubles the bill. Halving the event size does the same in the other direction. Compression only helps if the ratio is real for that payload.
A worked example
The default inputs are a busy API: 2,000 events a second, 1,200 bytes each, 30 days, a 4:1 ratio, $0.023 per GB-month. That is 172,800,000 events a day and 207.36 GB of raw ingest a day. Over 30 days the raw footprint is 6,220.8 GB. After 4:1 compression, 1,555.2 GB remain. Uncompressed, the same window is $143.08. Compressed, $35.77 if the gigabyte is decimal.
Decimal GB and billed GiB
Some vendors define the billed gigabyte as 2^30 bytes. 1,555.2 decimal GB is 1,448.392868 GiB, and $0.023 × that figure is $33.31. The estimator prints both so a pricing page cannot change the answer in a footnote. Read the vendor’s definition of GB before you pick a column. The MB to GB converter is the same distinction without the events.
What the ratio is
Enter how many times smaller the stored data is. JSON logs often compress somewhere around 4:1 to 10:1 with a general-purpose codec, and much more once they are columnar and sorted. If you measured a 75% reduction, the stored size is 25% of raw, so the ratio is 4. A number below 1 makes the data larger. The form will say so instead of quietly inflating the bill.
S3 storage cost calculator
Object storage such as Amazon S3 is billed per GB-month, and the rate depends on the region and the storage class. Requests, retrieval and data transfer are billed separately. Enter the per-GB price from your provider’s current pricing page in the price field, and the estimator applies it to the stored gigabytes in both decimal GB and binary GiB.
Questions
How do I estimate log storage cost?
Multiply events per second by the average event size in bytes, by 86,400, and by the retention in days. Divide by the compression ratio. Multiply the resulting gigabytes by your price per GB-month.
Should the compression ratio be 4 or 0.25?
Use 4 for 4:1 compression. The stored size is the raw size divided by the ratio. 0.25 would make the stored data four times larger.
Does a longer retention cost more forever?
It costs more for as long as you keep the longer window. The bill tracks the footprint, which stabilizes at events × size × window, not at the lifetime sum of everything ingested.
Is $0.023 the right price?
It is a common on-demand object-storage example, not a quote. Replace it with the figure on your pricing page, including retrieval if you actually read the logs back.
How much does S3 storage cost per GB?
There is no single price. It varies by region and storage class and changes over time, and requests, retrieval and transfer are billed separately. Read the current number from the provider’s pricing page, enter it as the price per GB-month, and the estimator shows the monthly cost for both GB and GiB billing.
Related tools
Not all data needs the same home
The fix is not “keep less” across the board. It’s to notice that the value of observability data drops as it ages, while the cost of storing it stays the same unless you move it. That’s the idea behind tiering: put recent data on fast, expensive storage and older data on slower, cheaper storage, then delete it when nobody needs it.
Elasticsearch’s index lifecycle management names the phases clearly: hot (actively written and queried), warm (no longer written, still queried), cold (queried rarely, slower is fine), frozen (queried very rarely, very slow is fine) and delete. Other systems use different words, but the shape is the same.
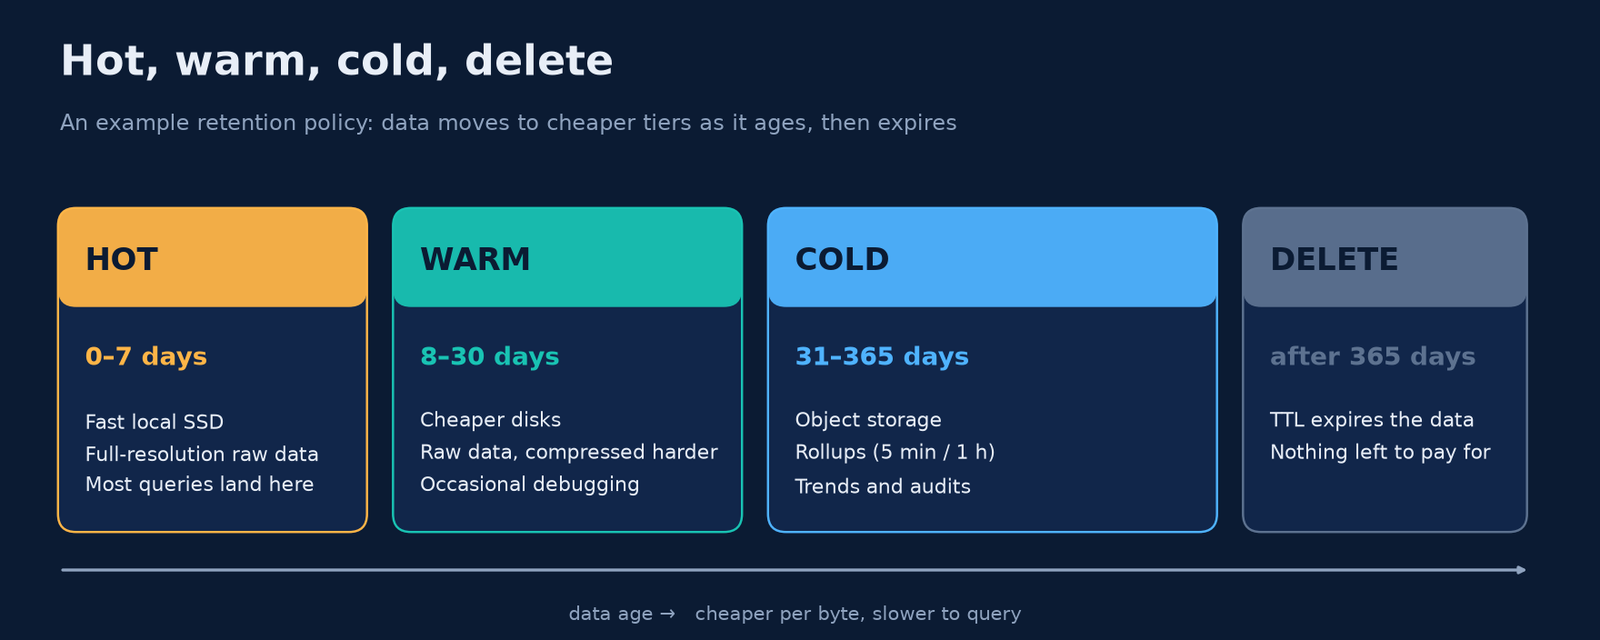
Look at what tiering does to the 90-day example. If only the last 7 days are hot, the hot tier holds 604.8 GB, which is 7 ÷ 90, or about 7.8%, of the 7,776 GB total. The other 7,171.2 GB still exist, but on storage that costs less per byte. You haven’t thrown anything away. You’ve just stopped paying premium rates for data nobody is querying.
TTLs: let the database do the moving
You don’t need a cron job for this. Most time-series and analytical databases let you declare the policy on the table and enforce it automatically.
In ClickHouse, a TTL clause can delete rows, move data to another disk or volume, or roll rows up into aggregates once they pass a certain age. A hot/warm/cold setup is a few lines, for example TTL ts TO VOLUME 'hot', ts + INTERVAL 7 DAY TO VOLUME 'warm', ts + INTERVAL 30 DAY TO VOLUME 'cold'. Two practical details from the ClickHouse TTL guide are worth knowing:
- TTL rules are applied during background merges, not the instant data expires. By default delete TTLs are re-checked at least every 4 hours (
merge_with_ttl_timeout= 14,400 seconds). - Partition by the same time column you use in the TTL. Then ClickHouse can drop whole partitions instead of rewriting parts row by row.
Prometheus has a simpler model: one retention window, --storage.tsdb.retention.time, which defaults to 15 days if you set neither a time nor a size limit (Prometheus storage docs). Long-term systems layered on top usually add tiers and downsampling.
Downsampling: keep the shape, drop the detail
For metrics, there is a second lever beyond moving data: downsampling, also called rollups. Instead of keeping a sample every 10 seconds forever, you keep one summary per 5 minutes or per hour.
The arithmetic is striking. A series scraped every 10 seconds produces 86,400 ÷ 10 = 8,640 samples a day. At 5-minute resolution that’s 288 points a day, and at 1-hour resolution, 24.
To check how that translates into bytes, we generated 50 synthetic gauge series (think CPU usage, with a daily cycle, noise and rare spikes) at 10-second resolution for 30 days. That’s 12,960,000 samples. We stored them as Parquet with zstd compression, then built 5-minute and 1-hour rollups that keep four values per bucket: min, max, sum and count.
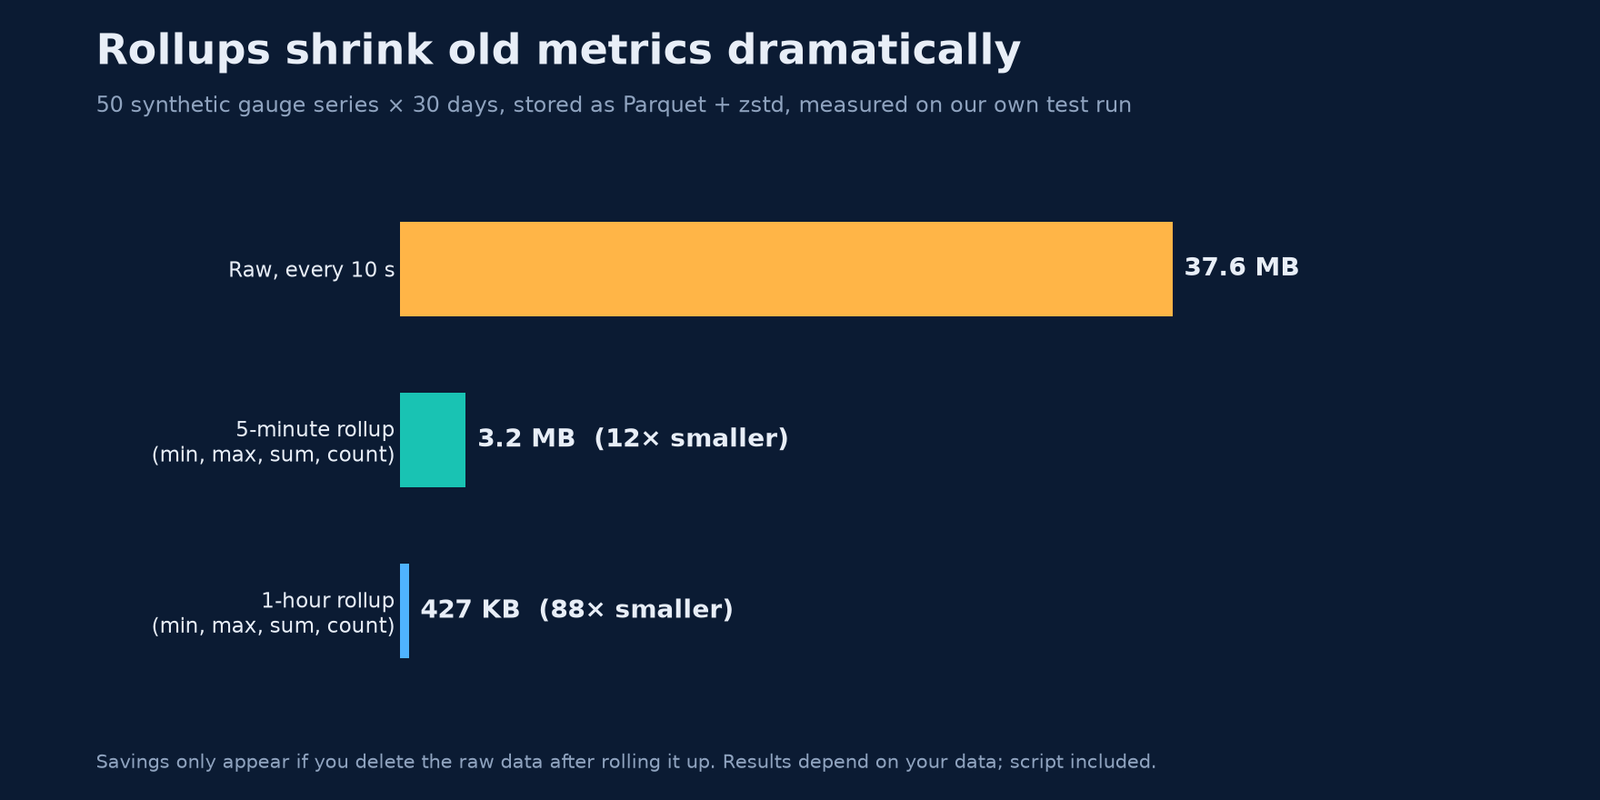
On this sample, the 5-minute rollup was about 12× smaller and the 1-hour rollup about 88× smaller than the raw data. Synthetic data is tidier than real metrics, so treat these as a direction, not a promise.
One important catch: rollups only save space if you delete the raw data afterwards. The Thanos compactor docs are refreshingly honest here. Thanos creates 5-minute downsampled blocks for data older than 40 hours and 1-hour blocks for data older than 10 days, mainly to make long-range queries fast. If you keep all three resolutions, it warns that total storage can grow by up to about 3×. The savings come from giving each resolution its own, shorter retention.
Why rollups keep min and max
An average is a lossy summary. A one-minute CPU spike inside a 5-minute window almost disappears when you average it with four quiet minutes.
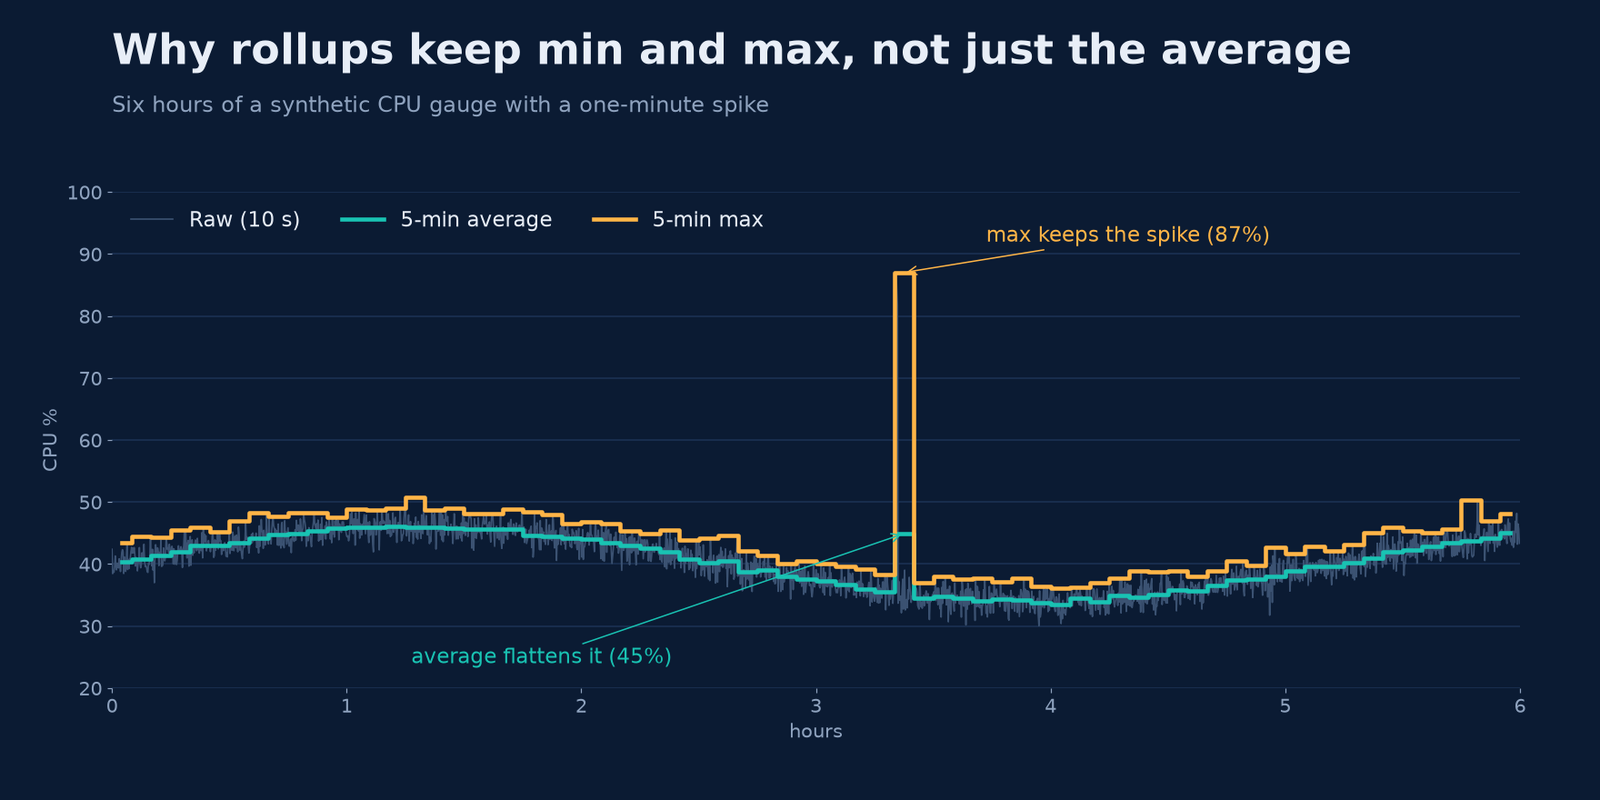
That’s why good rollups store several aggregates. Elasticsearch’s downsample action keeps min, max, sum, value_count and avg for each metric field. Thanos keeps count, sum, min, max and a counter. With sum and count you can still compute a correct average over any longer window. With max, the spike survives.
A practical retention checklist
- Write down how people query. How far back do incident investigations go? Dashboards? Audits? Let that set your tier boundaries.
- Do the multiplication. Daily volume × retention × copies, per tier, before you buy disks.
- Separate logs from metrics. Logs rarely roll up well. Metrics roll up beautifully.
- Roll up, then expire the raw data. Keeping every resolution forever defeats the purpose.
- Keep min, max, sum and count in rollups, not just the average.
- Let TTLs enforce it, and align partitions with the TTL column.
- Treat deletion as a feature. Data you don’t keep is data you never pay for, back up or secure.
Get Byte2MB in your inbox
One clear, illustrated data explainer, regularly. No fluff, just the bytes that matter. Subscribe to the Byte2MB newsletter and follow along.
Sources: ClickHouse, Manage data with TTL · Prometheus, Storage · Thanos, Compactor and downsampling · Elastic, Index lifecycle management phases and actions. The rollup and spike figures come from Byte2MB’s own test on synthetic data; the script is available on request.